Make Time-Wasting Visible – and Reclaim an Estimated 15 Hours/Week
Example: An IT provider with 12 PCs. Wolfeye shows live who is working when – and where time is lost.
Many business owners have the feeling: “We are always busy – but still falling behind.”
This example shows how an IT owner with 12 PCs used live screen data to make time-wasters visible and
roughly reclaim about 15 hours per week in productive time.
The numbers are a model calculation – they are not a scientific study, but an illustration of what hidden distractions might look like in hours and costs.
Important: How you implement monitoring legally (information, consent, works council, etc.) depends on the laws in your country.
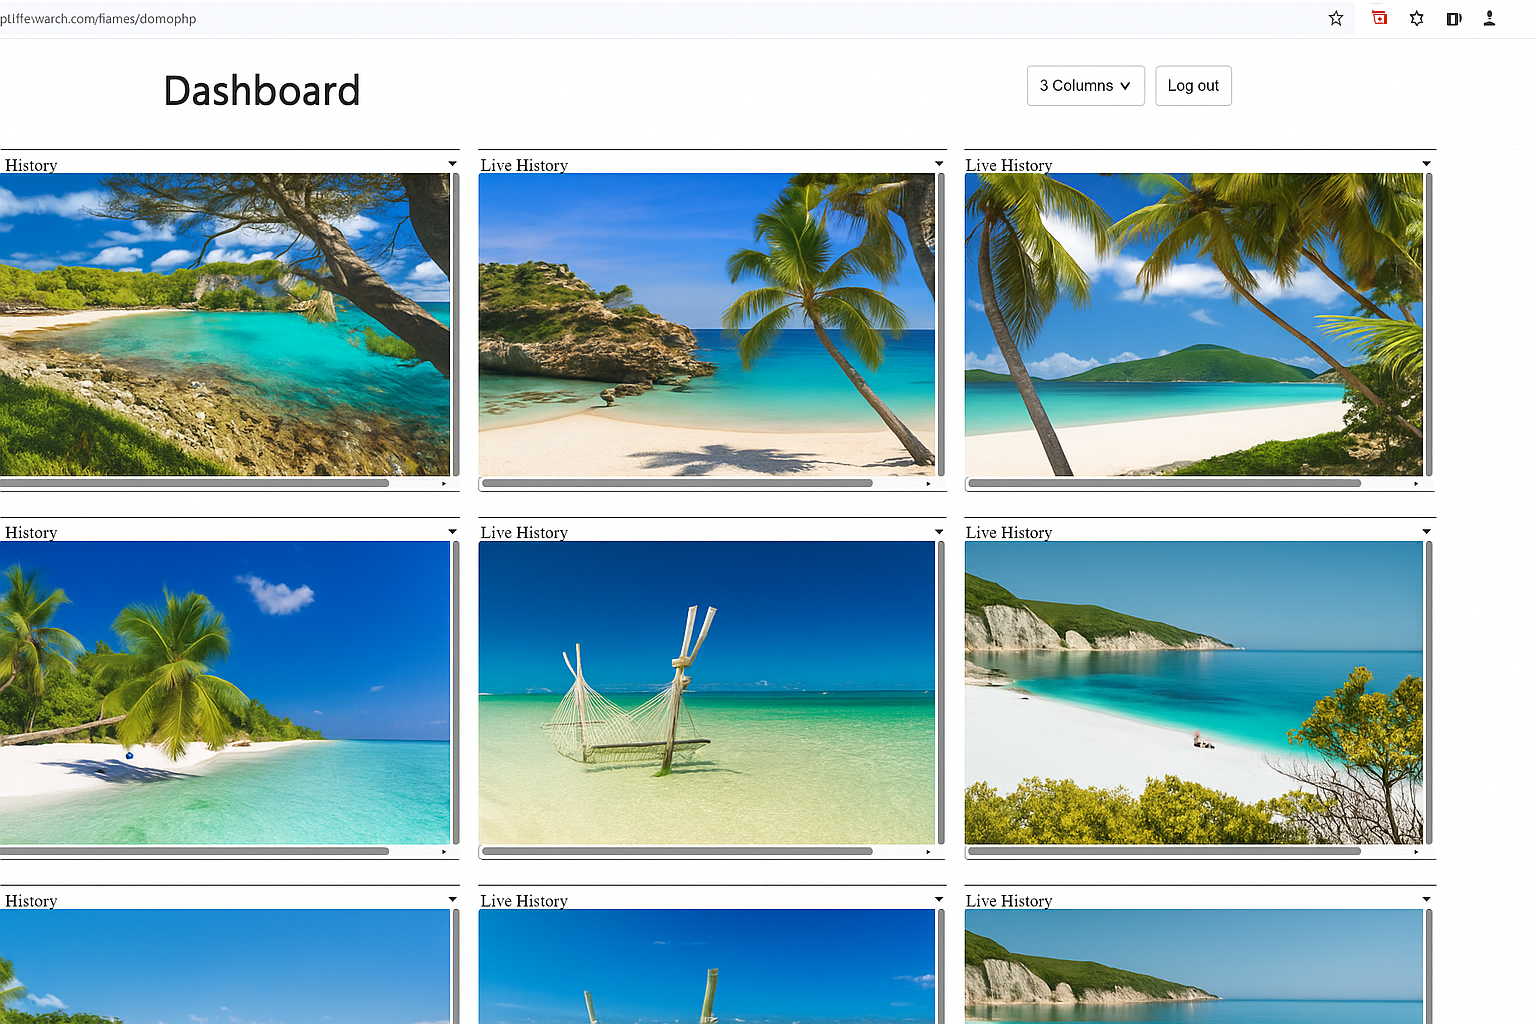
Foto: Wolfeye
The Core Problem: Invisible Distraction
In many companies, a relevant portion of working time is lost to activities that are not directly related to the actual job – like videos, social media or private browsing. Excel sheets, ticket systems or meetings only show this indirectly. Live screen visibility can help make loss of focus tangible instead of relying purely on gut feeling.
The Idea: Real Screen Data Instead of Guesswork
Wolfeye runs in the background and sends the current screen in short intervals to a central dashboard – so you can view multiple PCs at once.
By default, only the latest screenshot is kept on the server; each new image overwrites the previous one.
A permanent screenshot history exists only if you deliberately enable the history feature.
Important: Whether and how you must inform employees about monitoring or obtain their consent depends on
local labour and data protection laws in your jurisdiction (e.g., works council, internal agreements, consent).
We do not provide legal advice – you should consult a lawyer if in doubt.
Example: IT Provider with 12 PCs (Model Calculation)
Let’s take a simplified example scenario: an IT provider with 12 PCs looks at a few days of live screen data to understand when people are truly focused – and when they are frequently switching context.
From this, we build a model calculation for a typical week with 12 PCs.
The figures below are not a scientific study, but an illustrative calculation to show how common distractions might translate into hours and costs.
Illustrative Top Time-Wasters (12 PCs, 1 Week – Model Calculation)
| Platform / Activity | Time/Week (estimated) | Cost/Month (estimated) |
|---|---|---|
| YouTube / entertainment | 48 hours | approx. $1,200 |
| Social media | 32 hours | approx. $800 |
| Private emails / browsing | 20 hours | approx. $500 |
Before vs. After (Simplified)
Before (example): Many short interruptions, parallel browsing, no clear focus block.
After (example): Introduction of daily focus blocks (e.g., 9–11 am) where private pages are not supposed to be open.
In this model, result: significantly less distraction and roughly 15 hrs/week more productive time.
Why Continuous Data Is Valuable
Many companies manage productivity mostly based on feelings, tickets or time sheets. Continuous screen data can help you additionally understand
- where distractions cluster over time,
- which tasks require protected focus time,
- and whether new rules (e.g., focus blocks) are actually followed.
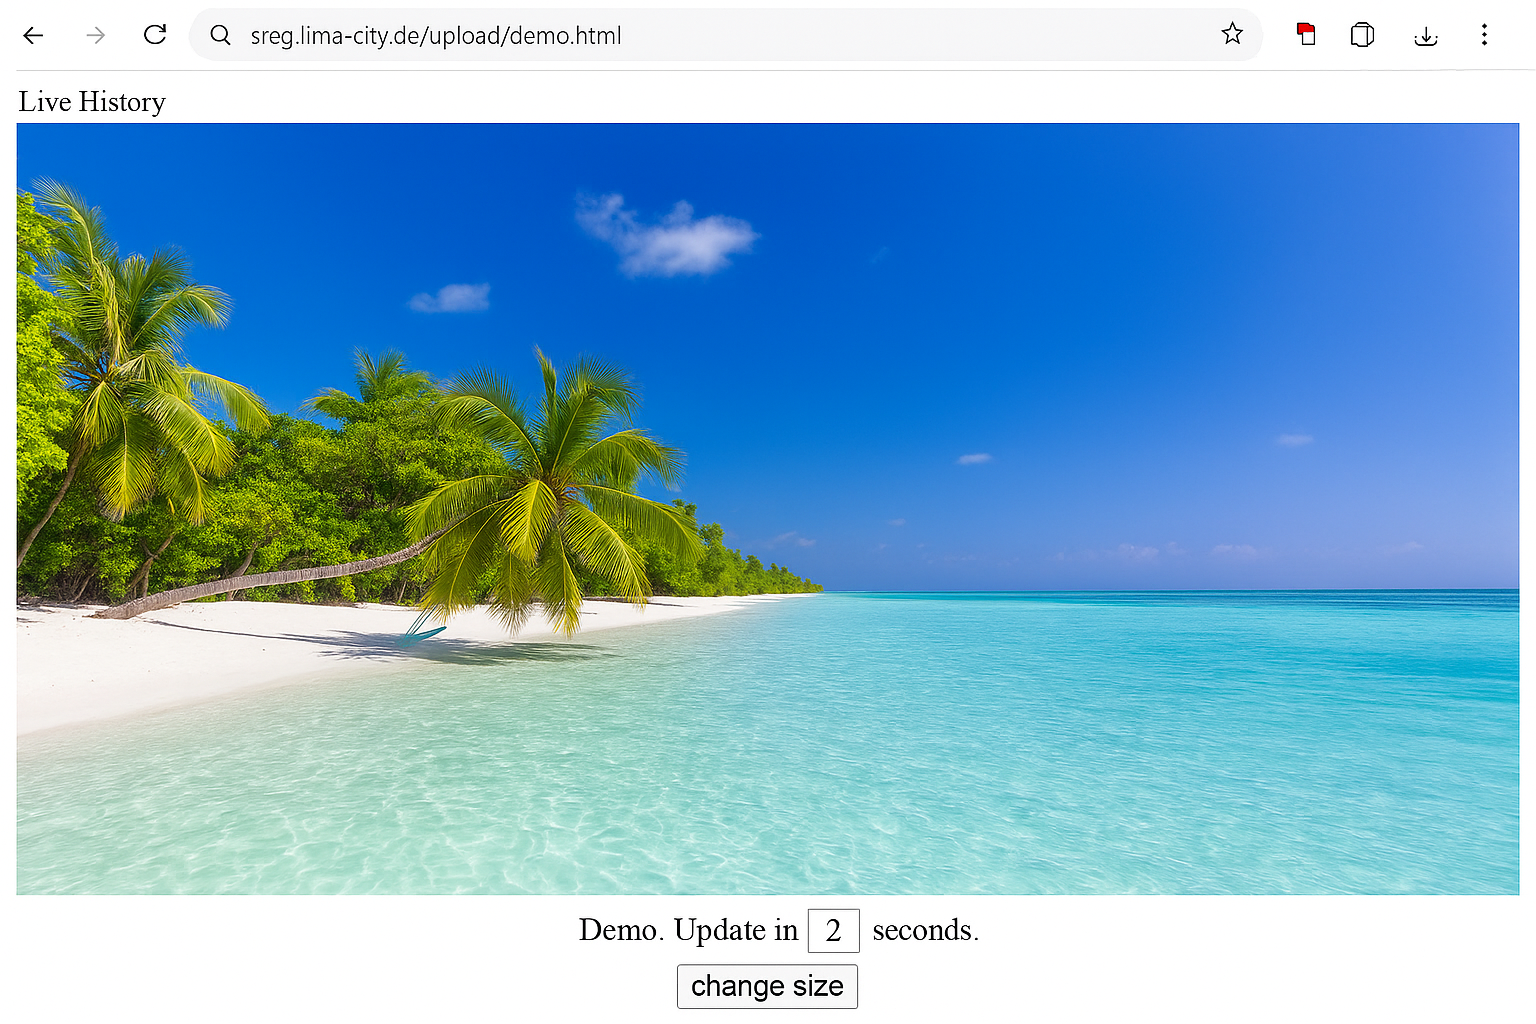
Foto: Wolfeye
Example 7-Day Plan (Not Legal Advice)
- Day 1: Technically install Wolfeye (around 5 minutes per PC) and ensure the solution aligns with your internal IT and legal setup.
- Day 2–3: Collect data and observe at which times context switching and distraction appear most frequently.
- Day 4: Identify patterns: Which hours seem calm and focused, when do “side activities” pile up?
- Day 5: Use these insights to plan focus blocks (e.g., mornings for deep work, afternoons for calls and emails).
- Day 6–7: Test the focus blocks, discuss with your team and observe results – where did you roughly reclaim time?
Frequently Asked Questions (Excerpt)
Technically yes – via internet or VPN, depending on your setup. Remote employees can also be shown in the dashboard if connectivity is in place.
The software is designed to run in the background and not stand out in everyday use. However, whether and how you must inform employees or obtain their consent depends on applicable labour and data protection laws.
By default, only the current screenshot is kept on the server – each new image overwrites the previous one. There is no permanent screenshot history as long as the history feature is disabled. Optionally, you can enable a “Screenshot History” feature – then screenshots are stored on the server at longer intervals. For details, see our privacy policy.
Licensing starts at around $80 per PC/year. See current pricing →
Yes – you can test Wolfeye for 14 days with full functionality. Start free trial →
Currently Wolfeye is focused on Windows systems.
Conclusion: Combine Gut Feeling with Data
This 12-PC scenario and the 15 hrs/week figure are a model calculation.
It illustrates how live screen data can help you uncover hidden time-wasters and then make better decisions –
such as introducing focus blocks or adjusting workflows.
How you use monitoring must always fit your team, your culture and the legal framework in your jurisdiction.
Wolfeye provides the technical capabilities – the legal setup should be reviewed with a qualified attorney.