How to Monitor All Company Computers Live from One Dashboard
How an SMB with 50 Windows PCs introduced a live monitoring dashboard, made digital work patterns visible, and used the data to reduce distraction and improve planning.
“I have 50 PCs – how am I supposed to keep an eye on all of them at once?”
That was the question one logistics manager asked their trusted IT provider.
The answer: a central live monitoring dashboard powered by Wolfeye, showing the most important company computers in real time.
In this article you’ll see a concrete example of how a company with around 50 Windows PCs rolled out Wolfeye, which metrics they looked at, and what changed in the first 30 days.
Important: All figures are example values from a single case and simplified internal calculations – your results will depend on your team, industry, communication and legal framework.
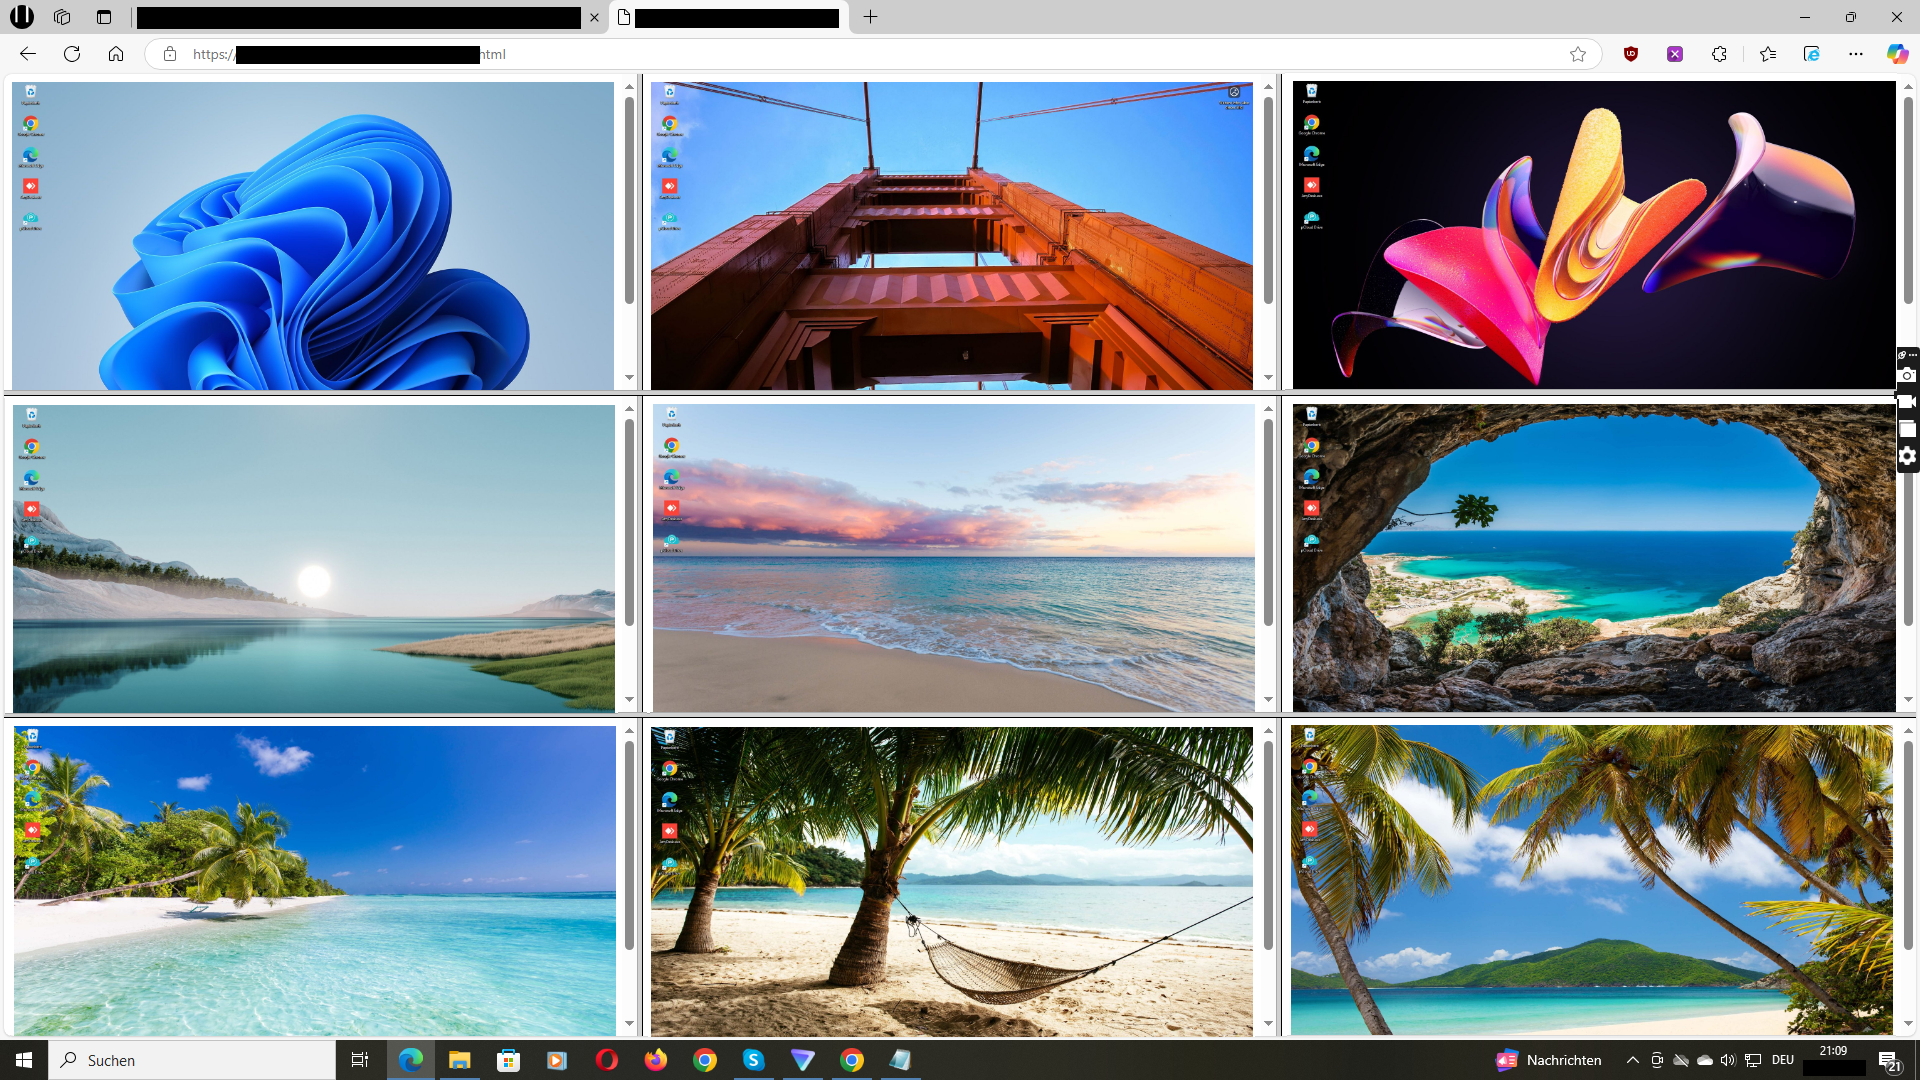
Wolfeye live dashboard – monitor multiple company computers at once
The Problem
In many organisations with 20+ PCs, employees spend part of their working day on purely private or non-work-related activities – social media, YouTube, shopping sites, private chats.
Managers see outputs and KPI dashboards – but often not what really happens on the screen during working hours.
Live monitoring tools like Wolfeye aim to close exactly this gap by making it easier to understand how digital work time is spent – always assuming the software is used in compliance with labour law, privacy law and with clear, transparent communication to employees.
The Solution: One Dashboard for All PCs
Wolfeye can run quietly in the background on Windows PCs in the office, at home or in hybrid setups.
Via a central web-based dashboard, authorised managers or administrators can view screens live, switch between devices and, if needed, focus on one specific workstation.
The solution can be scaled from small environments with just a few PCs to larger deployments. The exact technical setup (local network, VPN, browser access, etc.) depends on your infrastructure and should always be aligned with your IT and compliance requirements.
Live Demo: See Multiple Screens at Once (Video)
The video below shows a Wolfeye dashboard monitoring several PCs in real time. Your own setup may look similar – depending on your configuration and infrastructure.
Video: Wolfeye live demo – multiple screens in one dashboard
Example: Logistics Company with 50 PCs
A mid-sized logistics company with 50 Windows PCs (dispatch, accounting, customer service) wanted to better understand where time was being lost and why certain tasks regularly took longer than expected.
After introducing Wolfeye – alongside a written monitoring and IT policy shared with staff – the company collected data for several weeks. Over time, typical patterns emerged: private social media use in the morning, longer YouTube sessions after lunch, and personal email activity during peak customer times.
Based on these insights, the team defined focus blocks, clarified break rules and refined their internet usage guidelines. In the company’s own internal estimation, this led to a noticeable increase in the share of productive time and more reliable capacity planning. The numbers below are simplified example figures from this scenario.
Example: Top 5 Time Wasters Across 50 PCs (1 Week, illustrative)
| Activity | Time/Week | Estimated Cost/Month* |
|---|---|---|
| Social Media (private) | 45 hrs | ≈ $1,350 |
| YouTube & Streaming | 28 hrs | ≈ $840 |
| Private Emails & Chats | 20 hrs | ≈ $600 |
| Online Shopping | 12 hrs | ≈ $360 |
| Games & Downloads | 8 hrs | ≈ $240 |
Before vs. After – Example from One Company
Before monitoring: Management roughly estimated productivity at around 65–70 %, mostly based on gut feeling and a few KPIs. There was no consistent data on how screens were used during the day.
After roll-out and first changes: The company reported a clear reduction in obviously non-work-related usage during core hours and better utilisation of teams. In internal estimates, the share of productive time improved by roughly 20–30 %.
Note: These values come from a single case and are provided for illustration only. They are not a promise of specific results and cannot be directly transferred to other organisations.
Why a Central Live Dashboard Changes the Conversation
Once you have dozens of PCs in your environment, manual checking simply doesn’t scale. A live dashboard provides continuous visual information about how digital work time is being spent.
Used correctly – i.e. legally reviewed, transparently communicated and combined with clear policies – this data can support smarter shift planning, better onboarding and coaching, targeted training and process improvements.
Many IT providers choose to bundle Wolfeye as an additional recurring service within their managed offering. The exact markup, contract structure and scope of services always depend on the individual provider and their client agreements.
30-Day Roll-Out Plan for a Live Monitoring Dashboard
- Days 1–3: Clarify legal framework (labour law, privacy, works council/union where applicable) and draft a written monitoring & IT policy.
- Days 4–7: Install Wolfeye on a small pilot group, verify technical performance, dashboard access and permissions.
- Days 8–10: Inform employees transparently about purpose, scope, retention periods and access rights. Collect feedback and adjust where appropriate.
- Days 11–20: Roll out to additional PCs according to the agreed policy; start reviewing first patterns (peak times, recurring distractions, training needs).
- Days 21–25: Define focus blocks, optimise schedules, offer training and clarify expectations on internet usage during working hours.
- Days 26–30: Review results with management (and, if applicable, employee representatives), refine rules and establish monitoring as an ongoing, well-documented process.
Frequently Asked Questions
The dashboard can show multiple live views at the same time. In practice, many teams use a mix of overview walls and targeted single-screen views, depending on the situation.
No. Most organisations use live views selectively – for example during peak hours, in daily standups or for troubleshooting specific issues. Much of the effect comes from clear policies and the option to see what is happening, not from constant watching.
No. Wolfeye can be used in office-only, remote or hybrid environments. What matters is that the use is appropriate for the setting and properly communicated.
Access should be limited to clearly defined roles (e.g. certain managers and administrators) and documented in your internal policies and, where applicable, works council agreements.
Retention periods and screenshot history can be configured. You should always align these settings with your legal obligations (e.g. GDPR) and internal data retention policies.
Yes – you can typically test Wolfeye for 14 days to validate the technical setup and assess whether it fits your organisation.
Wolfeye is currently focused on Windows-based systems. For the exact feature set and system requirements, please refer to the product information on the website.
Conclusion
A live monitoring dashboard doesn’t replace trust – it complements it with facts.
The logistics example shows how Wolfeye can help companies understand digital work patterns, identify typical distractions and take targeted action. In that specific case, the organisation reported a noticeable improvement in productivity metrics – but every environment is different.
The key is to implement monitoring legally, transparently and fairly. If you do that, a live dashboard can become a powerful tool to optimise processes, support employees and reduce avoidable idle time – whether you manage 5 PCs or 500.
Want to see how a live dashboard would look in your company?
Start 14-Day Free TrialWolfeye is monitoring software. Use is subject to applicable labour, privacy and data protection laws in your jurisdiction. All figures and effects mentioned are illustrative examples based on internal analyses and customer reports and do not constitute any guarantee of specific results.