How to Monitor All Company Computers in Your Browser
A practical technical guide for SMB owners and IT providers: install on company-controlled Windows PCs, open one browser dashboard, and view live screens in a grid or single-screen view from your laptop or smartphone. No legal advice.
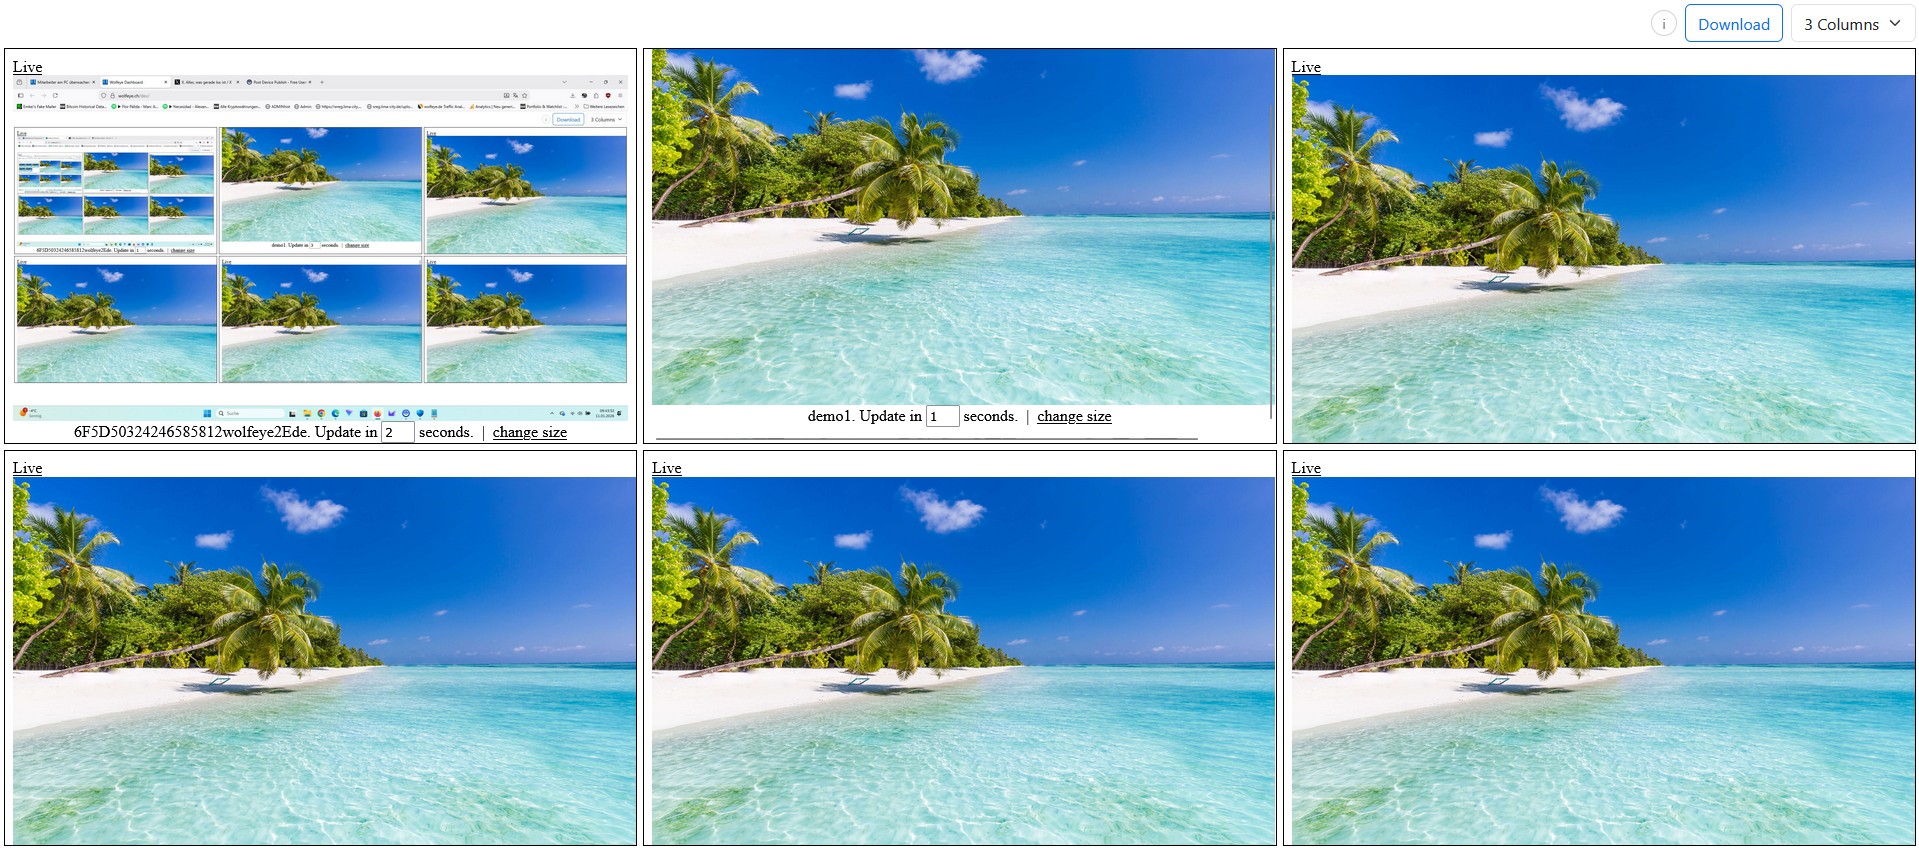
Illustrative browser dashboard image for monitoring multiple company-controlled PCs. Use only where lawful and with proper internal policies and user information.
Many SMB owners and IT service providers ask a very specific question: How can I monitor all company computers in one browser dashboard?
Not with remote desktop. Not with a heavy analytics suite. Not with ten separate tools. They want a simple setup where authorized people can open a browser and see what is happening on selected company-controlled PCs in real time.
This is exactly the use case for browser-based live screen visibility with Wolfeye Remote Screen:
- install a lightweight component on each company-controlled Windows PC you want to include,
- open your personal dashboard URL in the browser,
- see multiple screens in a grid, and open a single PC in a larger live view when needed.
Important legal notice: Monitoring is a legally sensitive topic and rules vary by country, industry and use case. This article is a technical and organisational guide only. It does not tell you what is legally allowed in your country. Before using Wolfeye or any monitoring software, always obtain independent legal advice in all relevant jurisdictions, and inform users / obtain consent where required.
This guide focuses on the technical workflow shown in the video: how to monitor all company computers using the browser and how to set up the dashboard so it is actually useful in daily operations.
1. What “monitor all company computers in the browser” means technically
When business owners search for this, they usually do not mean full remote control. They mean a view-only live dashboard that gives them quick visibility:
- Grid overview: several company PCs visible at the same time in one browser tab.
- Single-screen detail view: click one PC and open a larger live screen in a new tab.
- Browser access: works from a laptop, another office PC, or a smartphone browser.
- No constant user interaction: the software runs on the selected company PCs after installation.
Technically, Wolfeye Remote Screen uses a simple model: each monitored company PC sends current screen images to your dashboard, and the dashboard displays them in a browser. The live screen is updated regularly (the video explains the short refresh cycle), which is why the dashboard feels like a live overview without needing heavy video streaming.
This is especially useful for SMBs and IT providers because the workflow is visual and fast: scan the grid, spot something relevant, open one screen, then take action through your normal channels (phone, chat, supervisor call, support process). In many cases, that is more practical than starting a remote desktop session every time.
Legal reminder: whether you may do this, for which purposes, and under which conditions (information, consent, internal policy, contracts) depends on applicable law. Always confirm this with qualified legal counsel before deployment.
Example of a browser-based live grid dashboard with multiple company-controlled PCs. Technical illustration only. Real use must comply with local laws, contracts and internal policies.
2. Setup flow: from company PC installation to your browser dashboard
The setup concept is straightforward and is one reason this topic converts well with SMB owners and MSPs: the technical steps are easy to understand.
- Select the PCs: decide which company-controlled Windows PCs you want to include first (for example: support team, onboarding team, call center supervisors, or one pilot group).
- Install Wolfeye on each selected PC: install the Wolfeye component on every target device.
- Activate screen sharing: on each installed PC, enable the live screen sharing so the PC appears in your dashboard.
- Open your dashboard URL in the browser: this is your central place to view all screens.
- Refresh the page after installation: newly installed PCs appear in the dashboard after setup and a page refresh.
One practical advantage for IT providers is that this scales from a small test (5 PCs) to a larger rollout (25, 50 or more) without changing the core workflow. You are still using one browser dashboard as the viewing layer.
For many teams, this is also easier to explain internally than a complex monitoring suite: “We install the software only on approved company PCs, and authorized viewers use one browser dashboard for purpose-driven checks.”
Legal reminder: only install monitoring software on devices that you own or control and for which you have a clear legal basis. Private devices and cross-border setups are often more sensitive. Always obtain legal advice for your specific situation.
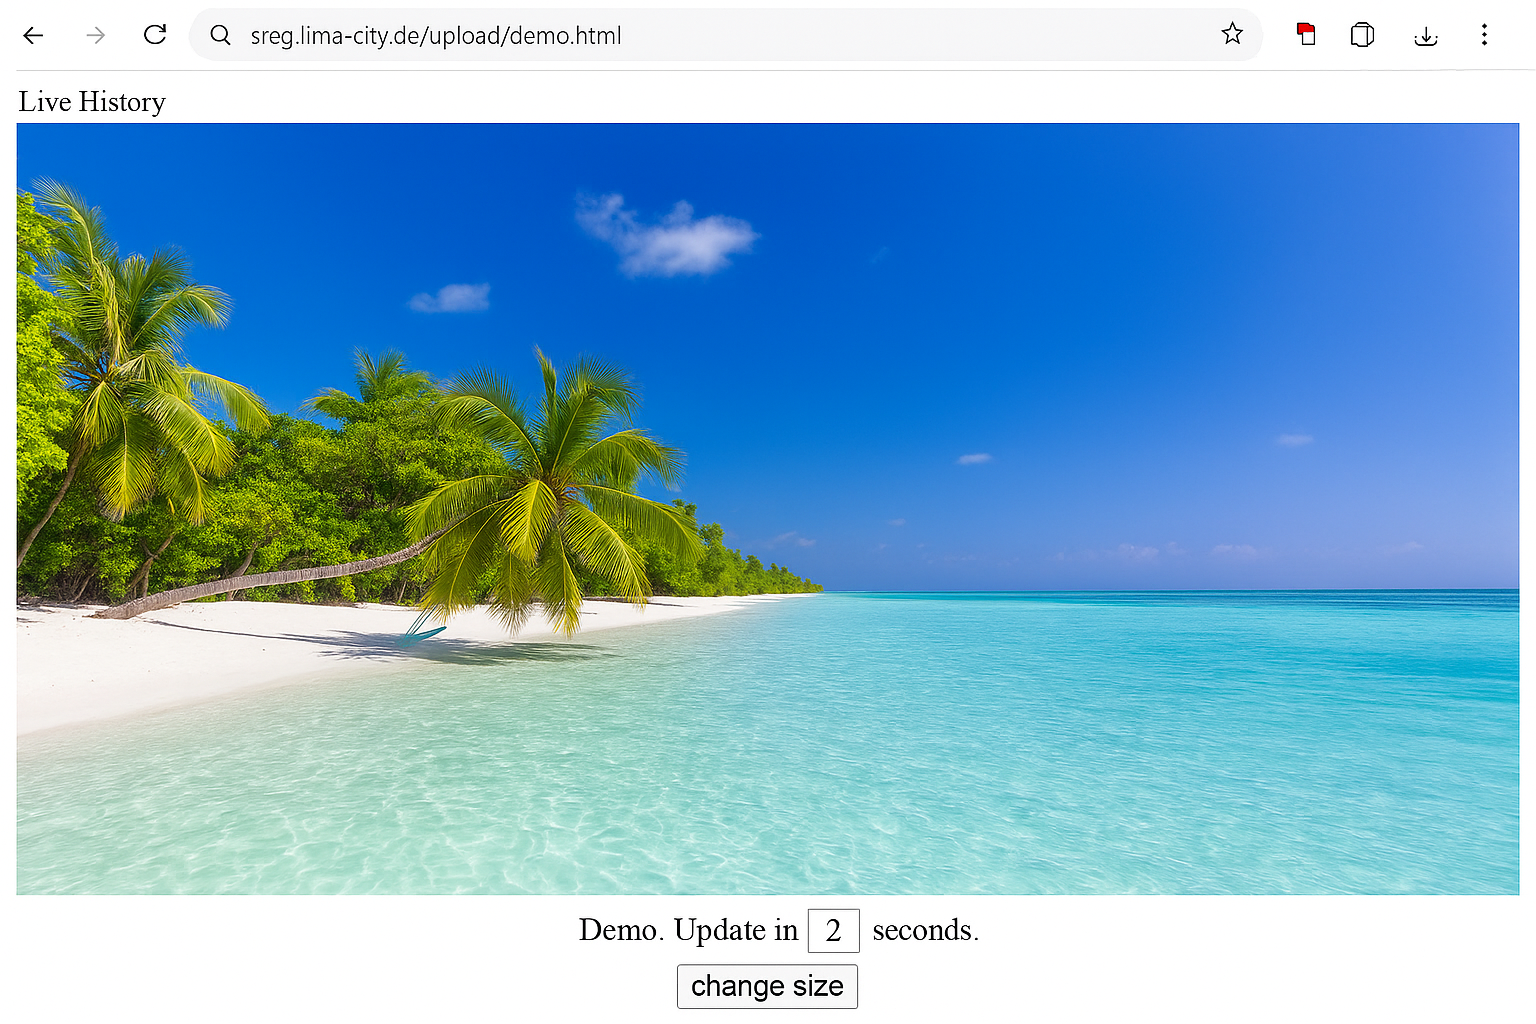
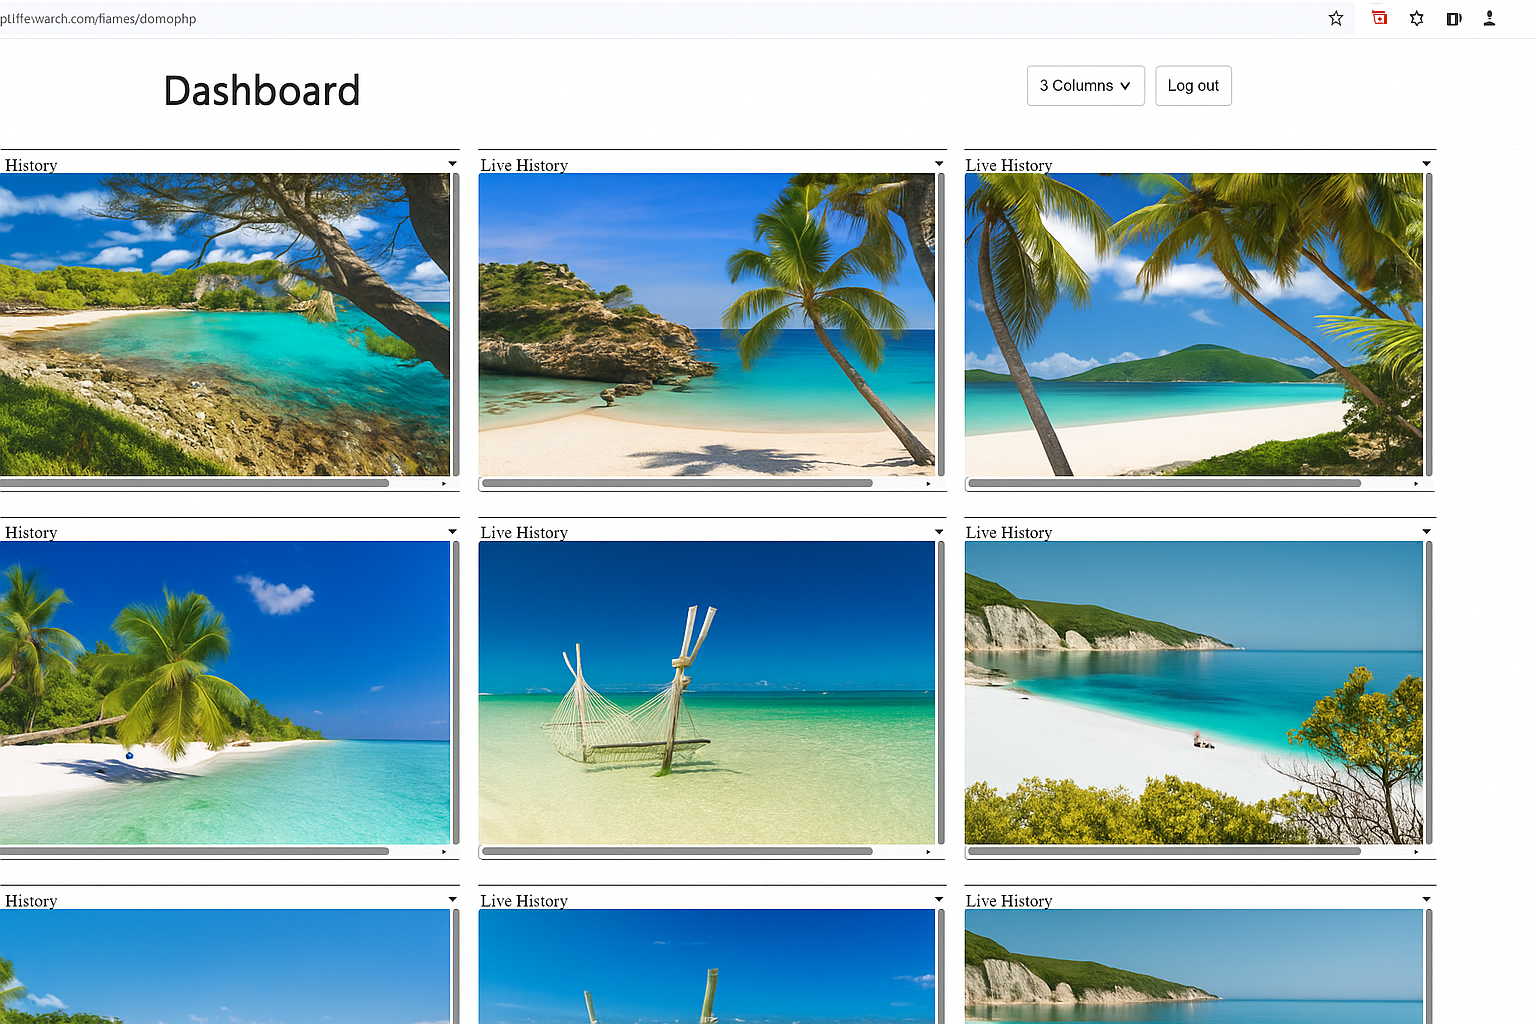
Single-screen live view opened from the browser. Useful for training, QA and troubleshooting workflows. Technical illustration only and not legal advice.
3. How to organize the browser dashboard so it works for real teams
The dashboard itself is where many deployments either succeed or fail. The software may work technically, but if the browser view is messy, supervisors stop using it. The goal is to make the dashboard feel like a clean operational view, not a wall of random screens.
3.1 Use the grid as your “radar”
The grid view is best used as a short overview screen, not as a constant surveillance wall. A practical routine is:
- open the dashboard at the beginning of a shift,
- do short spot checks during critical periods,
- open a single screen only when a real question exists (training, QA, support, incident clarification).
3.2 Adjust the number of screens shown
The video shows an important usability detail: you can change how many screens are visible at the same time. This matters because there is always a trade-off:
- More screens visible: better overview, smaller tiles.
- Fewer screens visible: bigger tiles, easier detail recognition.
For example, a supervisor team might prefer a denser grid during peak hours and a larger view during coaching sessions. This small dashboard setting has a big impact on daily usability.
3.3 Naming convention matters more than people think
Before you install on many devices, define a naming format such as:
Support-BER-01Onboarding-LIM-03CallCenter-MAD-12
Why this matters: when you click a PC name in the dashboard, you want to instantly know which team and location you are opening. This is especially important for IT providers managing multiple clients.
Legal reminder: dashboard access should be restricted to authorized viewers only. Define who may view which PCs and for which purpose, and document that access model as part of your internal process.
4. Single-screen view, smartphone access and everyday browser workflows
One of the strongest reasons to write this article as a dedicated SEO page is that many buyers specifically search for a way to monitor PCs from a browser and from anywhere. The browser workflow is not just a feature; it is the operating model.
4.1 Open one PC in a larger live view
From the grid, you can click a PC name and open that computer in a larger live view. This is useful when:
- a new hire is stuck and a trainer needs context,
- a supervisor wants to verify a workflow step,
- IT support wants to understand what the user is seeing before calling them.
The key idea is: overview in the grid, detail in single-screen view. This reduces friction and avoids constant context switching.
4.2 Browser access from smartphone
The video also highlights a high-value use case for owners and managers: opening the dashboard on a smartphone browser. This is useful if you are traveling, visiting another location or simply away from your desk but still need a quick overview.
In many SMB environments, this is a major advantage over tools that require a specific desktop viewer app. You can open the dashboard URL in a browser and check your approved PCs from almost anywhere with internet access.
4.3 Keep checks short and purpose-driven
From an organisational perspective, browser-based visibility works best when teams define clear reasons for checks (training, QA, support, incident response) instead of leaving the dashboard open all day without a purpose. This improves adoption and reduces the risk of misuse.
Legal reminder: whether remote browser access is allowed for your use case depends on local law and your internal rules. Always align your deployment with legal advice, policies and user information requirements.
5. Optional screenshot history: when to use it and why many teams start with live view only
The browser dashboard workflow already solves many operational questions with the live grid and single-screen view. For some teams, that is enough. Others ask for a history feature to review past screenshots later.
In the video, the screenshot history is described as an optional feature and is not enabled by default. When enabled, screenshots can be stored periodically and opened later for review. Technically, this can be useful for:
- short QA review windows,
- training follow-up,
- clarifying a workflow issue after the fact.
However, many SMBs and IT providers intentionally start with live view only because it is simpler operationally and avoids unnecessary data retention. A good rollout pattern is:
- Start with live browser dashboard only.
- Validate that supervisors actually use the grid and single-screen view productively.
- Enable any history feature only if there is a clear business purpose and a defined retention rule.
This approach is usually easier for adoption because teams learn the core workflow first: grid overview and targeted zoom-in.
Important legal reminder: any screenshot history can create additional legal, privacy and retention obligations depending on your country and use case. Before enabling history, obtain legal advice and define internal rules for purpose, access and retention/deletion.
6. Browser-based rollout plan for SMBs and IT providers (practical 7-step approach)
If you want this article to generate qualified leads, it helps to give readers a rollout model they can actually follow. Here is a practical browser-first rollout pattern that works for both SMBs and MSPs:
- Pick one use case: onboarding, QA, support triage, or incident clarification. Do not start with everything at once.
- Select a pilot group: 5 to 10 company-controlled PCs.
- Install and activate: complete the installation on each pilot PC and confirm they appear in the browser dashboard.
- Define viewer roles: who can open the dashboard, and for what purpose.
- Set naming and grouping: use a clear device naming convention before scaling.
- Run for 7 to 14 days: test real workflows (training, QA, support), not just the technical setup.
- Review and scale: keep live view if it solves the problem; only add history if there is a clear need and legal sign-off.
For IT providers, this same structure is easy to package as a managed service: pilot, rollout, then monthly review. For SMB owners, it keeps the project focused and avoids overcomplication.
Legal reminder: before pilot or rollout, verify legal requirements in all relevant countries and ensure users are informed and consent is obtained where required.
7. Video: How to monitor all computers in your company using the browser
This video demonstrates the exact browser workflow: install Wolfeye on selected company PCs, open your dashboard URL, use the grid view, open a single screen in a new tab, and (optionally) access screenshot history if enabled.
Important: the video is a technical demonstration and does not replace legal advice. Use monitoring software only where lawful, on company-controlled devices, and with required user information / consent.
Video: “How to monitor all computers in your company using the browser”. Technical demonstration only. Legal admissibility depends on your country, contracts, internal policies and specific use case.
Frequently Asked Questions – Browser-Based Company PC Monitoring
No. This workflow is different from remote desktop. Wolfeye is used as a browser-based live screen visibility dashboard: you open a browser, see multiple screens in a grid, and open one screen in a larger view when needed.
Technically, yes. The browser-based dashboard can be opened from a smartphone browser as well. Whether this is allowed for your setup depends on your company policy and local legal requirements.
No. Many teams start with live view only. Screenshot history is optional and should only be enabled when there is a clear purpose and a legally compliant retention approach.
No. This article is technical and organisational information only. Monitoring laws differ by country and use case. Always obtain independent legal advice and inform users / obtain consent where required before deployment.
Conclusion
A browser-based live dashboard is one of the simplest ways to monitor selected company computers without overcomplicating your workflow.
For SMB owners, it provides fast visibility for onboarding, QA and support. For IT providers and MSPs, it is a clean operational model that is easy to deploy and explain to clients: install on approved company PCs, open one dashboard in the browser, and use the grid as a radar with targeted single-screen checks when needed.
The strongest setup pattern is usually the simplest one:
- start with a small pilot on company-controlled PCs,
- use live view in the browser first,
- define viewer roles and naming conventions early,
- and only add screenshot history if there is a clear reason and legal sign-off.
Always remember: technical possibility is not automatic legal permission. Before using Wolfeye in any real environment, obtain independent legal advice in all relevant countries and make sure your deployment follows local rules, contracts and internal policies.
Want to see your own browser dashboard with live company screens?
Start 14-Day Free Trial
Wolfeye is monitoring software for company-controlled PCs. Any use must comply with the laws and regulations that apply in all relevant countries, your industry and your specific use case (for example training supervision, quality assurance or security). In many jurisdictions, permissibility depends on prior information, consent, contracts and internal policies. This article and the embedded video are for general technical and organisational information only and do not constitute legal advice or a guarantee of legal admissibility.
Before using any monitoring software such as Wolfeye, always obtain independent legal advice in all relevant countries about whether and how you may monitor company-controlled PCs, for which purposes, and under which conditions users must be informed or give consent.